MARKET RETURNS: Global markets finished the year on a strong note. Foreign stocks led the way, bringing 2025 returns above 30% for both developed and emerging markets. Currency exposure contributed to those results as the U.S. dollar index declined more than -10% in the first half of the year before rebounding slightly in the second half. U.S. large company stocks posted strong results as well, albeit slightly off the 20%+ pace seen in 2023 and 2024. Domestic small caps also produced double-digit gains as Fed interest rate cuts signaled some potential relief for those companies, which tend to be more indebted and less profitable. Falling rates also boosted intermediate-term bond prices, augmenting a healthy starting yield to generate total return. Currency was also a tailwind for foreign bonds, though their outperformance was more moderate compared to equities. Cash returned over 4% for the year, although recent rate cuts caused the Q4 return to fall below 1% and should reduce yields going forward.

LOOKING FORWARD:
Physical Outshines Digital Gold: The stars aligned for precious metals in 2025. A weakening U.S. dollar, safe haven appeal amid geopolitical uncertainty, central bank purchases to diversify reserves, and participation by momentum-driven traders all contributed to a surge in prices. Gold futures finished the year up over 64%, as silver and platinum more than doubled (see chart). While gold fundamentals remain supportive, we’ll likely take some profits within portfolios holding it when we rebalance in Q1.

Gold is a peculiar investment. It has value primarily because humans have collectively ascribed value to it. Unlike some other precious metals, its industrial applications are quite limited. Therefore, its price is driven more by supply/demand dynamics and related sentiment than underlying economic conditions. This dynamic extends even to institutional buyers such as central banks, who balance their reserve mix based on perceived risks. Gold has played a similar role for millennia.
Recently, precious metals have faced some competition from digital assets such as bitcoin. Many of the previous comments regarding gold valuation apply equally to cryptocurrencies. Yet a key difference is track record: bitcoin has been in existence less than 20 years and market dynamics are still being established, as evidenced by October’s liquidation event. Digital assets could eventually have a role to play in client portfolios, though we are more comfortable with precious metals for time being.
Gloomy Consumers Keep Spending: Consumption is key to U.S. economic growth, accounting for roughly two-thirds of gross domestic product. Consumers are doing well by many measures: wages have increased, debt payments are relatively low as a share of income, and net worth is up largely thanks to higher home and stock prices. Yet sentiment remains depressed, falling to levels typically only seen during recessionary periods (see chart).
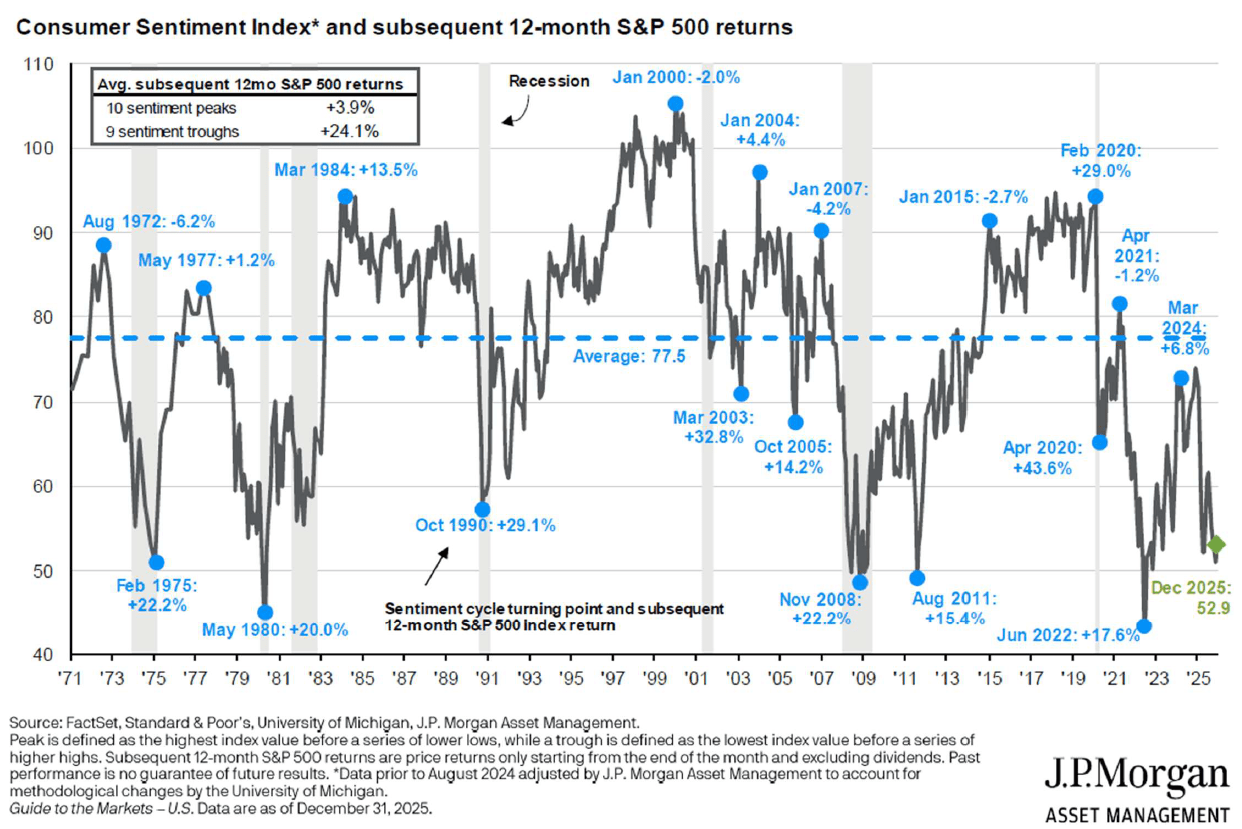
We see three main reasons for the apparent disconnect. First, the job market is cooling. This hasn’t yet translated into widespread layoffs or high levels of unemployment, although the “low-hire/low-fire” environment marks a distinct change from the job seeker’s market of a few years ago. Even white-collar workers face insecurity related to artificial intelligence. Second, prices have increased significantly even if the rate or change has declined (see chart). Things cost much more than they did before the pandemic, offsetting wage gains and leading to ongoing sticker shock. Finally, not all consumers are created equal. Wealthier cohorts that own homes and stocks have experienced outsized benefits from related appreciation. Meanwhile, excess savings that had accumulated during the pandemic have been largely exhausted for lower income consumers.

We see two reasons for optimism in these mixed signals. Actions speak louder than words (or sentiment) and most indications suggest consumers continue to spend despite economic anxiety. Sentiment surveys also tend to serve as a contrarian indicator for investors, with stronger stock market returns following depressed readings.
Conclusion: We are constructive on markets headed into 2026 while staying mindful of risk factors. It was encouraging to see the benefits of diversification in 2025 after several years in which most other asset classes were overshadowed by large U.S. growth stocks. Economic growth remains healthy in most parts of the world, company profits are strong and growing, and corporate and consumer balance sheets are in good shape. We still find bond yields attractive, even if compensation for credit risk has compressed. Risks to monitor include asset valuations, the U.S. fiscal position, challenges to central bank independence, inflation, geopolitics and trade policy, as well as a potential artificial intelligence bubble. We maintain a positive outlook for client portfolios in the year ahead, with the potential for more moderate returns and periodic bouts of volatility.
We wish you all the best in the new year!
Index Descriptions:
S&P 500 Index TR is a market capitalization weighted index which represents the broad market for large company U.S. stocks. Returns reflect the reinvestment of dividends.
The MSCI EAFE Index NR USD is a market capitalization weighted index which represents the broad market for large and mid-sized developed market stocks excluding those from the U.S. and Canada. Returns reflect the reinvestment of dividends and foreign withholding taxes and are translated into U.S. Dollars.
The MSCI EM Index NR USD is a market capitalization weighted index which represents the broad market for large and mid-sized developing market stocks. Returns reflect the reinvestment of dividends and foreign withholding taxes and are translated into U.S. Dollars.
The Bloomberg U.S. Agg Bond Index is a market capitalization weighted index which represents the broad market for taxable investment grade U.S. dollar denominated bonds. Returns reflect the reinvestment of interest.
The US Treasury Bill Auction Avg 1-month is an index comprised of short-term U.S. government-issued investments with yields collected weekly and can be considered a proxy for cash.
Portfolio performance, characteristics, and volatility may differ from the benchmarks shown. Opes portfolios are managed according to their respective strategies which may differ significantly in terms of security holdings, industry weightings, and asset allocation from those of the benchmarks. Benchmarks are unmanaged and provided to represent the investment environment in existence during the time periods shown. An index is not available for direct investment, and does not reflect advisory fees, any of the costs associated with buying and selling individual securities, or any other fees, expenses, or charges. Past performance may not be indicative of future results.
The opinions expressed in this article are for general informational purposes only and are not intended to provide specific advice or recommendations for any individual or on any specific security. All opinions expressed herein constitute the judgment of the author(s) as of the date of the report and are subject to change without notice. The material has been gathered from sources believed to be reliable, however Opes cannot guarantee the accuracy or completeness of such information, and certain information presented here may have been condensed or summarized from its original source. This information may contain certain statements that may be deemed forward looking. Please note that any such statements are not guarantees of any future performance, and actual results or developments may differ materially from those discussed. Opes does not provide tax or legal advice, and nothing contained in these materials should be taken as such. As always please remember investing involves risk and possible loss of principal capital. Advisory services are only offered to clients or prospective clients where Opes and its representatives are properly licensed or exempt from licensure. No advice may be rendered by Opes unless a client service agreement is in place.


