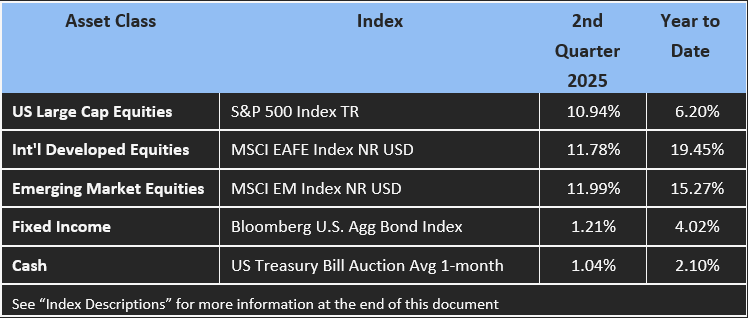
MARKET RETURNS: What a quarter! Global equities ended up posting double-digit gains after an initial sell-off in reaction to “Liberation Day” tariff announcements. The S&P 500 briefly entered bear market[1] territory intraday the following week, then finished at an all-time high after the announcement of a 90-day implementation pause drove a dramatic rebound in stock prices. Foreign stocks outperformed, although by a narrower margin than might have been expected given the acceleration in U.S. dollar depreciation. Growth stocks beat their value counterparts in a reversal of the Q1 dynamic. Fixed income was positive as well, with international bonds outperforming as the dollar weakened and many foreign central banks continued to cut rates. U.S. bond returns consisted mainly of coupon payments with interest rates finishing the quarter little changed. Municipals underperformed as selling ahead of Tax Day coincided with volatile markets and thin liquidity. Returns on cash remained consistent while the Fed maintained its policy rate in the face of tariff-related uncertainly regarding prices and the labor market. Precious metals continued to move higher, benefitting from both safe haven status and inflation hedge properties.
LOOKING FORWARD:
Dollar Dynamics: The U.S. dollar has weakened meaningfully so far this year after an extended period of strengthening in the post financial crisis era. Concerns around a negative impact to U.S. growth from tariff policy is often cited as the cause, though a confluence of factors is probably at play. The implications are mixed for both companies and households. Americans embarking on summer travel abroad will find their purchasing power diminished, while globally diversified portfolios have benefitted from the associated foreign currency exposure.
The dollar index remains moderately above its long-term average after a -10.7% decline in the first half of the year, as shown in the chart below. It has averaged about 92.5 since 1990 using monthly data, whether looking at mean or median. While the index is a useful single measure, individual currency pair performance has varied. Within the G10, the USD weakened over -14% against the Swedish krona and less than -5% against the Canadian and Australian dollars.
While the bias is arguably for further downside ahead, competing forces have the potential to drive the dollar in either direction. A weaker dollar could result from ongoing policy uncertainty and concerns around fiscal trajectory (more on that below), as well as a slowing domestic economy and associated rate cuts from the Federal Reserve. On the other hand, monetary policy that keeps rates “higher for longer” and demand associated with the dollar’s role as a global reserve currency could provide support.
The dollar should maintain its reserve currency status near-term, if for no other reason than a lack of viable alternatives. The chart below compares th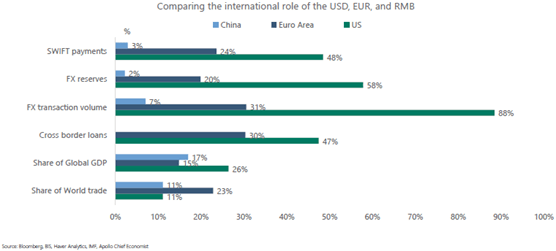 e USD against two potential replacement candidates. The dollar dominates by every measure aside from share of world trade. Although certain foreign central banks have been aggressively buying gold, those purchases tend to be from countries with limited Western trade and financial ties.
Big Beautiful Bill: The One Big Beautiful Bill Act (OBBBA) was signed into law on July 4th. It incorporates several important provisions for investors and taxpayers. Many of the pillars of the original Tax Cuts and Jobs Act (TCJA) of 2017 were made permanent. It also lifted the state and local tax (SALT) deduction to $40,000 and increased the gift and estate tax exemption to $15 million per person, among other changes. Many of these tax code revisions may present opportunities for strategic planning.
The OBBBA is projected to accelerate future increases in debt as a percentage of gross domestic product due to ongoing deficit spending (see below left). Support for budget deficits seems to be a rare point of bipartisan consensus in Washington and as a result the U.S. has not passed a balanced budget since 2001. This dynamic has in turn resulted in an accumulation of national debt (see below right). Entitlement reform is the most promising long-term solution, although unfortunately brinksmanship is likely given related political considerations.


Investors would do well to monitor the U.S. sovereign and associated interest rates. In May, Moody’s became the last of the major rating agencies to downgrade the United States, following similar actions from S&P in 2011 and Fitch in 2023. A combination of higher rates and ongoing debt issuance has caused interest payments to surpass defense spending for the first time. While tax cuts may provide a positive growth impulse, it could be accompanied by inflationary pressure including from tariffs. It’s hard to see meaningful downside to interest rates in the long run, benefiting savers while raising costs for borrowers.
Conclusion: For all the market’s gyrations, second quarter returns came in strong. Clients that rely on our quarterly reports to track their investments would have saved themselves quite a bit of consternation compared to those watching their accounts daily. Even during the depths of April, the overwhelming response was relief in resilient performance compared to dire headlines (almost certainly a function of inevitable comparisons to the S&P 500). An important part of our job, especially in volatile periods, is to help clients maintain a long-term orientation. A quotation from Nobel laureate economist Eugene Fama sums up the danger of reactionary trading nicely: “Your money is like a bar of soap – the more you handle it, the less you’ll have.” That’s not to say prudent (often contrarian) adjustments are never merited. The swiftness and magnitude of the stock market rally off the April lows seems unjustified by fundamentals, so we could be nearing a point where it makes sense to take some profit and redeploy proceeds into attractively priced, inflation-sensitive assets.
We hope your summer has been enjoyable thus far and wish you a pleasant remainder!
Index Descriptions:
S&P 500 Index TR is a market capitalization weighted index which represents the broad market for large company U.S. stocks. Returns reflect the reinvestment of dividends.
The MSCI EAFE Index NR USD is a market capitalization weighted index which represents the broad market for large and mid-sized developed market stocks excluding those from the U.S. and Canada. Returns reflect the reinvestment of dividends and foreign withholding taxes and are translated into U.S. Dollars.
The MSCI EM Index NR USD is a market capitalization weighted index which represents the broad market for large and mid-sized developing market stocks. Returns reflect the reinvestment of dividends and foreign withholding taxes and are translated into U.S. Dollars.
The Bloomberg U.S. Agg Bond Index is a market capitalization weighted index which represents the broad market for taxable investment grade U.S. dollar-denominated bonds. Returns reflect the reinvestment of interest.
The US Treasury Bill Auction Avg 1-month is an index comprised of short-term U.S. government-issued investments with yields collected weekly and can be considered a proxy for cash.
Portfolio performance, characteristics, and volatility may differ from the benchmarks shown. Opes portfolios are managed according to their respective strategies which may differ significantly in terms of security holdings, industry weightings, and asset allocation from those of the benchmarks. Benchmarks are unmanaged and provided to represent the investment environment in existence during the time periods shown. An index is not available for direct investment, and does not reflect advisory fees, any of the costs associated with buying and selling individual securities, or any other fees, expenses, or charges. Past performance may not be indicative of future results.
The opinions expressed in this article are for general informational purposes only and are not intended to provide specific advice or recommendations for any individual or on any specific security. All opinions expressed herein constitute the judgment of the author(s) as of the date of the report and are subject to change without notice. The material has been gathered from sources believed to be reliable, however Opes cannot guarantee the accuracy or completeness of such information, and certain information presented here may have been condensed or summarized from its original source. This information may contain certain statements that may be deemed forward looking. Please note that any such statements are not guarantees of any future performance, and actual results or developments may differ materially from those discussed. Opes does not provide tax or legal advice, and nothing contained in these materials should be taken as such. As always please remember investing involves risk and possible loss of principal capital. Advisory services are only offered to clients or prospective clients where Opes and its representatives are properly licensed or exempt from licensure. No advice may be rendered by Opes unless a client service agreement is in place.
[1] A bear market is defined as a decline exceeding -20%


